[Video] How Effective Is Your Fundraising?
Using Your Donor Data to Set Goals and Drive Decision-making
In this webinar, Brianna Klink looks at how to create a basic data dashboard to drive sound fundraising strategy in your nonprofit.
Edited Transcript:
Laura: Hey everyone! This is Laura Ingalls and welcome to “How Effective Is Your Fundraising?” Can everybody hear me? I hope you can.
I just want to take moment and talk about why we were inspired to offer a webinar about data. One of the things is that there was a study that came out from Hubspot and EveryAction a couple years ago that talked about only 40% of nonprofit professionals are using data regularly to make decisions. So 4 in 10 nonprofit professionals use data.
And from our perspective what that means is that there are some of you who are being held accountable to goals that may not have any basis in reality. And that can really affect your long-term prospects and where you’re working and your long-term happiness. And we do want everyone to be happy in the nonprofit world.
The second thing that inspired us is that we’re starting to talk to some fundraising teams this year that don’t really have a strategy in place for 2020. They don’t really have numeric goals and they’re not really sure where to focus. And all those answers are hidden in your data.
And the third thing is, and I know some of you may have experienced this in your nonprofit life, sometimes nonprofit leadership, our boards, get a little bit hung up in tactics. Maybe they love your gala, but they hate receiving email from you. And having a really good sense of your data can help you have better conversations to educate nonprofit leaders on what they should be focused on.
Because there definitely is forest and not just trees, both in terms of how our industry performs in fundraising and how your organization, what your data says about how your organization should perform and what you should focus on.
We’re going to have a lot of fun digging into data today. If you’ve met me you know I’m not a huge data geek and that’s why Brianna is going to work on this. And by geek, I mean the best thing possible.
I do want you to know in a couple weeks we’ll be turning a different page and I’ll be hosting a webinar on “How to Write Love Letters to Your Donors.” Today, we’re going to love some data and turn it over to Brianna.
Brianna: I'm going to get into some weeds today, but I don't want you to get too overwhelmed. For the most part, we just want to give you the context to help you make better decisions.
We're going to talk, first, about two different sets of data. What I call baseline data points. These are your macro view. Then, tactical data points, your micro view. It looks like a lot. But for the most part, I want to talk to you about why these things are important.
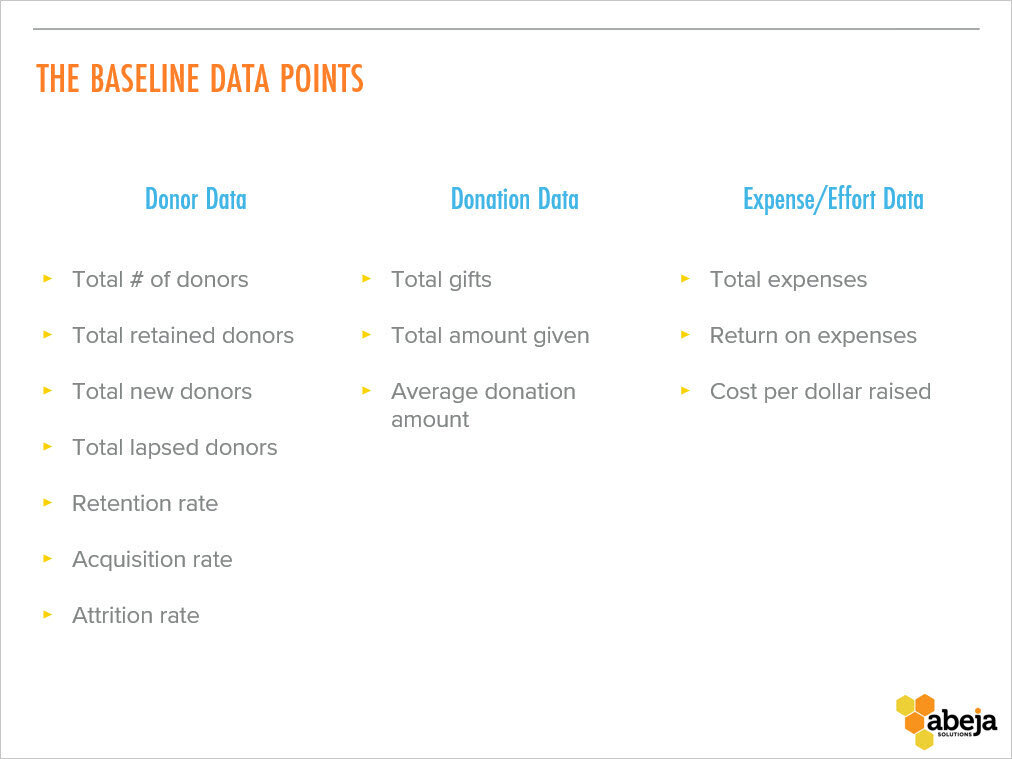
Baseline data points
Of course, if you have questions during the session, please put them in the chat box. I might not get to them right away, but we will get to them. So, from the macro view, you want to look at: how many donors you have, how many you retain, new donors, lapsed donors, and then some percentages: the retention rate, acquisition rate, and attrition rate.
Looking at money, your donations, you want to look at total gifts, the amount given, and your average donation amount.
Then we're going to talk a little bit about expense/effort data. Was the juice worth the squeeze? So, we're going to look at your total expenses, your return on expenses, and the cost per dollar raised.
Tactic-by-tactic data points
Now, the micro view. The micro view is really the stuff that you want to look at from a tactic-by-tactic viewpoint. So, whether this is a mail solicitation or it's a request for people to volunteer at a particular thing, whatever you solicited, you're going to look at the total responses and your response rate. If there's a donation attached to it, we'll look at total gifts, the total amount given, and the average donation amount.
The expense effort, the first three are the same as your macro view. But I add three other things that I like to talk about that are less statistics and more gut checks. One is hours of effort. Yes, you can count these so they are quantitative, but the opportunity costs and the ick factors are two things that I think we don't spend a lot of time on.
If you've ever been on Non-Profit Happy Hour, the Facebook group, and if you're not there, get an invitation. But a lot of the conversations are around like the non-profit industry just as a whole using and abusing our human labor. And if it's for the animals, if it's for our constituents, then it's always worth it. But then we end up licking envelopes at midnight. Is that really a good use of our time?
We also don't pay attention a lot to opportunity costs. So, if I spent a lot of time on this gala, what could I have done differently? I could have had one-on-one conversations with major donors. We could have done a picnic instead of this or that. There are a lot of variables at play, but I want you to just think about what else you could have done.

Let's get into the details on donor data. So, baseline – and if you don't have these statistics for your organization that you know already, then I encourage you to look at a baseline over the last three years, because that will even out some of the ups and downs of very large gifts, someone gave a $50,000.00 gift, or you had a huge acquisition.
Baseline: How many recent donors do you have?
So, we want to look at the number of households who gave in the last three years. To calculate this, just run a report in your CRM with the filters, with the date of your last gift greater or equal to 1/1/2017. We're just going to use calendar years for simplicity.
I encourage you to focus on heads of household instead of total individual donors, because it will start to skew your data and it's hard to see how many you really, truly have. You'll want to export that information with a first gift date and a last gift date and export it to Excel or CSV.
Everyone who's in the chat, can you let me know which CRM, which donor management system, you're currently using whether it's Network for Good or eTapestry or Little Green Light, Salesforce, or Luminate? I spent a lot of time in there.
All CRMs are slightly different and your mileage may vary for how to calculate these things. Oh, eTapestry. I'm sorry, Jennifer. I'm really sorry. So, with eTapestry, you actually have to run a query and then a report. It's a two-step process. It drives me crazy.
But you'll have to learn how your particular database talks about these particular variables. It might be, instead of gift, date of last gift, it might be date of last transaction. If you have a system that also does volunteer management and stuff like that, you'll have to figure this out.
But what I encourage you to do is, at the end of this session, take this basic process and write it down for your exact system so that any person at your organization can run the reports. If you can save those reports in your system, do that, too. Then you don't have to follow these processes over and over again. You just press a button. Anyhow, Network for Good, Salesforce, yeah, those two are pretty easy. eTap drives me crazy, though.
Baseline: How many donors did you retain?
So, total number of donors, how many did you retain? Looking at a three-year average, how many gave in the last calendar year? You might want to do this over five years. It really depends, but three years is a pretty good place to start.
Baseline: How many donors did you gain?
Then you want to look at total new donors. If you're particularly focused on acquisition, this will be a really good stat to pay attention to. If you're not focused on acquisition and not purposely looking for new donors, they may just pop in. You'll just want to monitor that over time. There are some instructions there, but I don't want to bore you with all of those.
Baseline: How many donors lapsed?
Last piece is a total lapsed donor. So, if you take your total donors and subtract your total retain donors and your total new donors, you get your total lapsed donors.
Baseline example: animal welfare organization
So, here's an example of a baseline. A three-year average for an animal welfare organization – these are actual numbers that I've pulled. So, over three years, there were 9,668 donors; 1,959 gave in 2019. They had over 3,000 new donors in 2019, and 4,000-something lapsed. So, what does this all mean? Is it good? Is it bad? What do you guys think? Enter in the chat. Not so great? Jennifer Hicks says, "Bad." Corbin says, "Not good." Maybe. Maybe.
We don't really have enough context to make a lot of inferences. It could be that this is an organization that is significantly changing their mission. So, they're purposely trying to shed donors and get new donors who are more aligned with their mission. It could be that there was a huge change in their donor base – like if this was a New Orleans animal welfare organization after Katrina, it would seem really, really normal because so many people left New Orleans that the demographics of the area changed. Right? So, we don't know whether this is all good or bad.
Baseline example: What percent of donors do you retain?
But what can help us to start comparing – and Laura's at the head of the class – is to start looking at percentages. Because percentages allow us to compare apples and oranges, within reason. So, an actual absolute of donors that you retain may not tell you a lot. But a percentage can help you compare year over year or to industry benchmarks as Laura just entered in the chat. So, she says that the industry benchmark is 45 percent retention. Great. So, all we know are the absolutes right now.
Let's figure out what the actual percentage rate was. So, retention rate. You want to just divide your total retained donors by your total number of donors. Easy enough.
Baseline example: What percent of donors lapse?
The opposite of that is your attrition rate. In the commercial world, they call it churn. Now this is the percentage of donors who did not give again in the last year. You can divide that lapsed donors number by your total number.
Baseline example: What percent of donors are new?
Then you've got your acquisition rate. These are your new donors. All three of these pieces will equal 100 percent.
Baseline example: animal welfare organization
So, now, let's see. We've got those absolute numbers. What does that mean for this organization? So, they are retaining 20 percent of their donors. Industry benchmark is 45 percent. If the organization is trying to be alongside industry benchmarks, then that retention rate is awful. If that retention rate may be better than last year. It may be better than the animal welfare organizations in its demographic area. It's influenced by a lot of things. But looking at percentages, you can start doing some comparisons of apples to oranges.
Tactic by tactic: How many donors did you solicit?
So, let's look at tactical data points. So, from a tactics point of view, did you mail an appeal? Was it this gala? Was it your major gifts program? We can look at slicing your total overall fundraising statistics into tactical things and then compare them. So, whenever you're using a particular tactic, I encourage you to create a campaign in your CRM or otherwise tag those donors with something that says they are part of this particular tactic. Right?
In Salesforce Luminate, you run a report and then you can select all of the households and add them to a particular campaign. So, when they respond, you can just run a report on those. I can't remember how to do it in eTapestry. Network for Good has campaigns, but – yeah, if you have specific questions about your particular system, I'm happy to follow up with you afterwards. But figure out a way to do this, and then write it down, so you consistently track your particular tactics. Whether that's a mailing campaign or gala or a volunteer program, consistently track them within your CRM.
Tactic by tactic: How many donors responded?
Depending on what your call to action was, or CTA, that's going to determine what your responses are. So, your call to action might be “give.” Your call to action may be, "Give us your mailing address." It might be, "Give us your email address." It may be, "Show up to this event." Based on whatever that call to action is, you can calculate your total responses.
So, in an ideal world, use those campaigns or tags in your CRM to pull that data. If you can't manage campaigns or tags, set up a campaign period. So, say, with like a direct mail piece, we usually do about six to eight weeks. So, any donations that come in during that period, from when it dropped to six to eight weeks later, those would be attributed to that particular campaign.
That's also really helpful when you're getting donations from a lot of different places like, you've got a PayPal thing, you've got an online piece, you've got mail, all these different places. Then, if you look at dates, you can sort of tag who was part of that campaign.
Tactic by tactic: What percent of donors responded?
Then you want to look at your response rate. So, who completed the call to action? Sorry, missed a bullet. So, who completed that call to action and divide that by total responses. I'll fix that before I send that to you guys.
All right so, now let's talk about the money. But before I go into that, I am boring everyone? I promised that I'd throw a few jokes in here. But are there any questions? Are you snoozing? Is this helpful? Give me some feedback so I cannot do that or do more of that in the next section.
Okay, I've got a, "This is great." Fill my ego. Thank you John. Okay, great. Fantastic. I want – I don't like talking into the void and I want you to get some benefit out of this time you spend with us. So, fantastic.
Baseline: How many donations did you receive?
So, we're in fundraising. So, money, money, money, money. Let's talk about the money. So, looking at a baseline, we want to look at the total number of gifts over the last three years, right? So, we're going to look at your CRM. You want to look at journal entries or transactions instead of contacts or accounts. But do include the account information when you output the report.
Fun thing with Excel is if you select any column of data, in the bottom right-hand corner, it will show you the count of records. So, you never have to scroll all the way down and minus one. I did that for many years and then someone, some genius showed me that trick. So, always use Excel. It's your friend. Select a column and it will show you the count in the very bottom of that little task bar.
Baseline: How much money did you receive?
Total amount given, right, that's also something that's interesting to look at. You can – we're talking about a baseline over three years right now, but once you get these basics, slice and dice as you please. You can look at year over year.
Baseline: What amount do donors typically give?
Then the average gift amount is also going to be helpful for you. To do that, you just divide the total amount given, your total revenue, by the total number of gifts.
Tactic by tactic: How many donations did you receive?
From the tactical perspective, it's the same sort of thing, total gifts. Now we're not talking about responses, at this point. Right? If your call to action was for volunteers or for someone to give you their email address, you're not going to measure these things, because they're irrelevant. But if you are doing a fundraising campaign, then you want to track the same things. Total gifts for the campaign, total amount given, and the average gift amount.
How much did you spend?
So, is the juice worth the squeeze? Right? You don't know that unless you start looking at your expense and effort data. So, how much did you spend? You can use these exact same statistics for both your baseline, your macro view and tactic-by-tactic.
Actual expenses can be hard to determine. You can focus on direct expenses – your postage, your paper, that email system. MailChimp is not free once you have over 2,000 people. Right?
You can also look at your indirect expenses – wages, benefits, office space. It's harder to calculate indirect expenses, of course, especially if you have – if you don't have dedicated fundraising staff, it's very hard to talk about wages. It's very hard to say, "Okay, well, I spent 20 percent of this time, blah, blah, blah, blah, blah."
So, all I recommend is to pick a method, write it down, and stick with it. Then you can start looking at things year over year. If you have a bookkeeper that can help you tag items in QuickBooks or Peachtree with fundraising expenses that will help you quite a lot.
If you can't really calculate like, "Okay, well, we spent this much on office supplies, like paper. Paper is not free. Envelopes are not free. You spend a lot of money on paper and envelopes and direct mail pieces. Do the best you can to estimate how much that particular campaign used. But pick a method, write it down, and stick with it. It's not going to be the same as every other organization's method, but it will give you something to look at and compare tactic by tactic or year over year.
What was your relative return on expenses?
So, depending on what your expenses are, your return on expenses are your net revenue divided by expenses. So, we'll see that in a second.
How much did it cost to raise $1?
The other important stat is cost per dollar raised. So, we all know the phrase, it costs money, you have to spend money to make money. Right? But do you really want to spend a dollar to raise a dollar? Maybe. Maybe that's actually a bargain especially if you're doing acquisition; you're trying to expand your donor base. You might actually have to spend $3.00 to make that $1.00. This is an average over time. Right? So, you just divide your total expenses by the amount raised.
Tactic by tactic: How much labor was involved?
Tactically, pay attention to how much labor was involved. I see this a lot with galas, with events. I ran into an executive director a couple meetings ago, just at an event. I said, "How was your gala?" And she's like, "I'm never doing that again." I said, "Oh no!" She was like, "Well, you know, we'll do the gala again, but I'm going to do something totally different because of the amount of effort that was required for this particular gala.
You want to pay attention to those things. Especially if you've got staff and volunteers that are doing a ton of labor, you want to make sure that they're involved in things that are fruitful and they want to be involved in. We'll get to that in a sec.
Tactic by tactic: What else didn’t happen?
So, opportunity costs. These are not – the next two items are not quantitative, but I believe that they're still very important. So, opportunity costs are all the things that you couldn't get done because you were doing this thing.
Laura and I, a long time ago, worked for a national animal welfare organization and our executive director decided that she wanted a donor brick walkway that took one of my staff members like 50 percent of the time for 6 months. It raised us like $12,000. But what Suzie, my employee, could have been doing would have raised a whole lot more. So, the brick walk was not a good use of our time. The opportunity cost was really high.
Tactic by tactic: What was the emotional/physical toll?
Then, there – you can call these by different names. I call it the ick factors. These are those intangibles, the things that make you think twice about repeating that effort.
If it really burnt out your staff, if you were super excited about the returns, if you felt like you worked too hard for too little. I'd encourage you just to think very basically about this. Right?
Here's a little Likert Scale from happy to not-so-happy. In our world, it's maybe less anger and more tears. But that ick factor, there's an emotional and physical toll of our work. Pay attention to where that particular juice is worth the squeeze.
“Lies, damn lies, & statistics”
This apocryphal quote wasn't actually said by Abraham Lincoln, but who knows? Everyone knows about lies, damn lies, and statistics. Right? So, the data is helping you just put a context and a story around what's happening in your organization. You can tell different stories based – but if you don't have these basics, you're going to be flapping in the wind. You don't know which direction to go.
Which apples? Which oranges?
So, what you need to start paying attention to is which apples and which oranges do we want to track? So, from a macro view, you can look at us versus industry benchmarks, our retention rate versus this, our – how well our mailings do versus industry benchmarks.
You can look at tactical things. Campaign A versus campaign B. If you are subdividing your donors into particular segments, you can look at which ones perform better; donor persona A or donor persona B; segment A or segment B? There are a lot of ways that you can slice and dice your apples and oranges.
Baseline example: animal welfare organization
Okay, so, now for the fun part. Let's go back to that animal welfare organization. We're looking at a macro view of all of the stats that I just discussed. They've been around for quite a while. So, I do have some information for a long period of time.
These are three-year averages entering in 2013, 2016, and 2019. What story can you tell with these statistics? What sort of changes are you seeing in this organization? I'll give you a few minutes to absorb and just answer your answers in the chat.
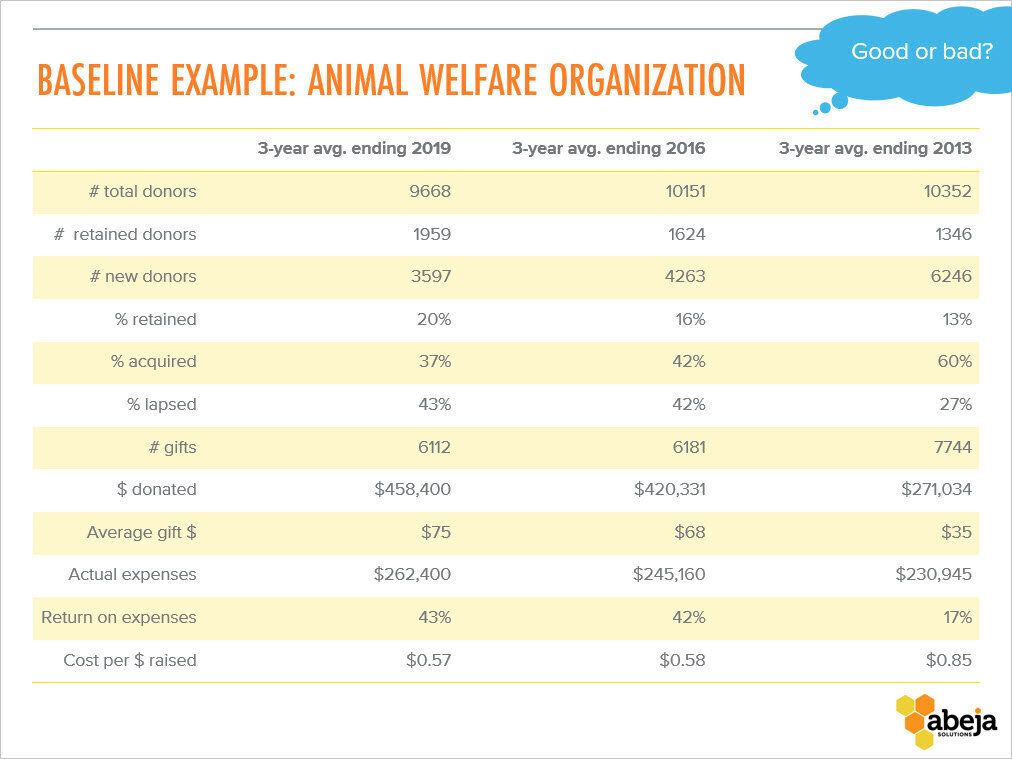
Good, good. So, someone's seeing a pattern that there are bigger gifts by fewer people. So, this might be an indication that this organization is streamlining their fundraising efforts. That is a good insight. Anne's saying that, "Focusing more on acquisition, now time to pay more attention to retention." Yep. So, Anne sees that six years ago, they were focused on acquiring new donors and that over time – and look at this retention rate. Right? 13 percent and the average is 45. Ew.
So, this 20 percent number for the year that just ended is actually a significant increase over time. It's definitely not industry average, but it is moving. Right, 20 percent here. So, we're increasing our retention, reducing the amount of – that needs to be acquired. The amount that has been raised has gone up quite a bit because the average gift is moved up. Expenses kept fairly steady, but because that average gift increased, the return on expenses is much higher than it was six years ago.
John is saying there were possibly problems with donor relations because retention was poor. Yeah, absolutely. But one thing I want to say, too, is like these statistics they don't mean anything without strategic goals. Right?
So, if you shared this piece with your board, if this was your organization and your board had approved a strategy to increase retention and increase the average gift rate, you would be getting hopefully a nice raise or at least some pats on the back. Right? But if the overall strategy was to increase the total number of donors then there are some failures here. But the numbers without the context of the strategy do not make much sense. You have to put them into the context of what the strategy is.
Tactic by tactic example: 2019 campaigns
So, let's look at some tactical examples. So, here's an organization that has had a spring gala, a direct mail campaign, Giving Tuesday digital campaign, email and social media and a holiday direct mail piece. These tactical items, this is where the sort of squishy items come in – the hours of effort, the opportunity costs, and the ick factor, as I call it. But what kind of story do you see here in this particular set of numbers?

Anne, you're after my own heart. Anne says, "Direct mail is a cost-efficient way to bring in income. The gala and Giving Tuesday may be more trouble than it's worth." That's one particular insight. So, this is what I see. Again, I have a little bit more inside information.
So, spring gala, there was a huge opportunity cost because there was a ton of effort by staff and volunteers that led to a missed grant deadline. Everyone was very exhausted and not super happy about how the gala went off. Donors had a great time, but staff and volunteers were not particularly happy.
So, I think events are important. I think one, two events, signature events for your organization are important for donor engagement. But what could we do to address these factors?
Maybe it's a matter of increasing your expenses by outsourcing to an event manager, definitely not me. That's the most stressful job in the world, as far as I'm concerned. Maybe if you had paid $18,000 for an event manager and then these hours of effort went way down. That changes your opportunity costs and it really gives you a much better response for your staff and volunteers.
Maybe that will help you increase the number of responses. Right? Now you afford to invite 2,000 people because that professional event manager can manage that event.
When you're looking at these pieces, you can start looking at which levers, which variables to focus on in order to change the entire picture. Right?
Perhaps it's increasing that average gift amount so that you can pay for that professional fundraiser. Or, as one organization we know, they turned a dinner event into a lunch event and it magically was much easier for them to manage internally. It had much lower costs, lower expenses, and therefore their return on expenses was much higher.
So, these numbers don't tell you whether something was good or bad. They help you determine what is working and what you might need to change.
Yes, I love direct mail, but I do want to focus on Giving Tuesday. So, Anne said maybe Giving Tuesday is not as much – may be more trouble than it's worth. If you're looking at it from a strictly fundraising point of view, $600 for 85 hours of effort, eh, I don't know about that. However, they had 392 people that gave the organization their email address. So, now this organization can send them more emails. So, the social media campaign got the responses that they want.
Then, they took those email addresses and turned them into mailing addresses. So, this holiday direct mail campaign actually was higher than their summer. Right? So, if you're looking at acquiring new donors, maybe Giving Tuesday is worth the effort. If you're looking at just the fundraising aspects, then maybe it's not.
The numbers don't say whether something was successful or not. It's comparing the numbers to what your goals were that will help you determine whether your fundraising tactics and baselines are effective. Does anyone have any other insights on these particular numbers? Then, if not, we'll talk about what you need to know for your organization.
Put a basic & consistent dashboard in place
So, these are basic dashboards. These are little tables that I made in Power Point. But I'm a huge fan of writing things down so you have a system in place so that it is consistent and then you can start comparing your apples and oranges.
If you are recreating a system every time your board asks for something or your executive director wants to know X, Y, or Z, you're going to start making mistakes. It's also just a lot of labor on your part. So, do what you can to systematize your data. Say, "These are the things that we're going to track over time, and until we get these right, no shiny objects."
I know that that's not actually feasible in the real world, but if you say it enough times, maybe someone will follow along. But until you have consistent data on these basic items, I wouldn't recommend going into anything deeper. You can create statistics for lifetime value of a donor or how many average gifts per donor per year or how many this that and the other. You can always calculate the stats, but focus on the basics, get those right, and then add one or two more things over time.
Set up automated reports, systems
Set up your systems – if you can set up reports in your donor management system, do that. If you can automate them, do that. If you can't, set up a simple system using Google Sheets or a – if you have board meetings every quarter, this is the exact same Power Point slide that will be given at every single meeting so that everything's consistent. You can create a little, basic dashboard like these tables.
Questions & Answers
All right, so I ran over a ton of dry math material over the last 50 minutes. What do you have questions about? What is your organization struggle with data wise that I might be able to help or your fellow participants might be able to help with? Anne asked, "How to build our list, acquire new donors with a small budget?"
So, ask your donors. If you have donors internally, ask your friends of friends. Laura says, "Friend get a friend." You don't need to pay for acquisition lists at that level. We can help you with that, certainly, but the cheapest, easiest way is to start expanding your circle. "Hey donor, would you introduce me to a friend of yours that might be interested in our organization?"
Jennifer asks, "Simple strategies to steward a small donor file. We're around 250." Simple strategies. Direct mail and email. If you – here's the basics, right. Stewardship requires communication. What we like to say is don't – Laura, how do we say this? Don't apologize for being small. Apologize for being silent. Donors actually want to hear from you. Building connections with them takes time and energy. Right?
For 250 people, you might be able to even ask them, ask each one, honestly, how they prefer to be communicated with. That might be difficult from a labor point of view, but if there's – if you get your entire board to do a call campaign, you can hit that 250 pretty easily. But yeah, like Laura says, make your donors feel great. Whatever tactic you are using, whether it's mail or email or social media, always keep the focus on the donors. Make them feel good.
So, who, at the end of this, thinks, "Okay, this is manageable"? Who thinks, "Oh crap, I don't know how I'm going to get this done"? Okay, thank you Anne. So, Anne says that it's doable, but it requires putting time aside to set it all up. Yeah. Like any good system – and I definitely don't want to put any blame on anyone. I think it's just the nature of modern life and our work, but taking the time away from actual mission-driving work, it's hard for us to wrap our heads around stepping back and figuring out what is actually a good use of our time and energy.
But if you put – let's say it takes you two full days to get your database, reports set up, and a little dashboard, but how much time is that going to save you at the end of the year when board member X is asking you for Y? But it's hard to see that when you're in the thick of it and we are trying to go from fire to fire.
But I would very much encourage you to do it. Some people – if it feels overwhelming to you, find someone on your staff that loves Excel, that is compulsively organized. I had to color-code my Legos before I would go to bed when I was a kid. I am compulsively organized. They'll love setting these up. But if you find it a struggle, find someone who will really love it.
So, we have another person that says, "We have dedicated the rest of this quarter to cleaning and reviewing our data, developing a strong stewardship plan, and overall fundraising strategy." I applaud you MacBook Pro, who I'm sure has a real name. But she or he brings up an excellent point that cleaning your data – data hygiene is absolutely critical for getting good results and that also takes effort and maintenance. But the results are quite beneficial.
Yes, using that data to develop an overall fundraising strategy, that's what this is all about. I can't tell you what your strategy should be from a global perspective. It may be that you have to triple the number of donors and you're willing to put some investment behind that, because of X, Y, and Z, your expansion plans, all that sort of stuff. Without a strategy, the numbers don't really tell a story.
Jennifer asks, "Do you have simple ideas for cleaning data?" Yes, I wrote a data hygiene series of blogs. That is a step-by-step guide for cleaning your data. If you have very little time, just do the first phase. It's a three-step process and it gets more and more detailed as you go. But you'll see some improvements over the first phase, the first few steps, all that.
If you are struggling with data hygiene, again, find someone who is really good at it – who is compulsively organized and has that system sort of viewpoint. You can always hire me. I woke up this morning thinking of how to rewrite an Excel formula. So, yeah, that's my own personal journey.
Okay, well, we're five after and you guys are non-profit professionals. So, I know you have things to do, money to raise, missions to get to. So, please do contact me if you have any other questions. We'll share this recording and the deck with you. I'm happy to give you some basic advice. If you're struggling with a particular thing, always willing to help. Yeah, absolutely.
Laura asks, "We'd love your feedback on whether this was helpful for you." I want to be helpful. I want to save the world through you guys. So, was it helpful or not? Thank you for joining. Thank you for giving me a week to sleep and recover from illness. I hope you guys all have a happy and healthy January and a very, very profitable 2020 where your fundraising is concerned. Thank you everyone.
You Might Also Like
Basic Nonprofit Fundraising Plan [Free Download]
Better Donation Letters & Email Through Data Hygiene: Part 1
To Grow the Fundraising Pie, Balance Your Strategies
Photo by Mateusz Dach from Pexels